I added observability to a RAG pipeline this week. The instrumentation went in, the eval suite ran clean, 40 questions scored end to end. Then I opened the Langfuse dashboard and it said 1 trace tracked. The Scores panel said No data. I had expected something north of a hundred traces, each carrying its own faithfulness, relevance, and precision scores.
Nothing had errored. The numbers in my terminal were correct. The dashboard, the thing whose entire job is to make production behavior legible, was quietly telling me my mental model was wrong.
Here is what was actually happening, why it is an easy trap, and how the fix changed the shape of every trace.
The setup
The project is a retrieval-augmented generation pipeline: ingest documents into a vector store, retrieve the top chunks for a question, and have Claude answer using only those chunks. On top of it sits an eval harness that runs 40 golden questions through the pipeline and scores each answer on three dimensions with an LLM-as-judge:
- Faithfulness (1 to 5): does the answer stick to the retrieved context, or hallucinate?
- Relevance (1 to 5): does the answer actually address the question?
- Precision@3 (0 or 1): did the retrieved chunks even contain the answer?
The goal for the week was simple on paper: wire in Langfuse so every query is traced with its cost, latency, and scores, then screenshot a dashboard with 100+ requests in it.
Gotcha one: the SDK moved out from under me
My first attempts used langfuse.trace(), the pattern I half-remembered. It does not exist in the current SDK. Langfuse moved to a context-manager instrumentation model (start_as_current_observation), and the code I was writing from memory was a version or two out of date. This is the boring, recurring tax of building on fast-moving libraries: training data and blog posts age faster than the APIs do. Reading the current docs first would have saved me an hour. Lesson logged, again.
Once I was on the context manager, cost and latency started landing automatically. That part genuinely is free: the context manager times each span, and Langfuse computes cost from the model name plus the token usage I was already reporting. So far, so good.
Gotcha two: the trace count was a structure problem, not a logging problem
Here is the part that actually mattered. My eval runner looked roughly like this:
with langfuse.start_as_current_observation(name="eval_run"):
    for item in dataset:
        result = query.main(item["question"])   # opens its own span
        score(result)                           # opens more spans
That outer eval_run span sets itself as the active context. Every span created inside it, all 40 queries and all their children, nests underneath. Langfuse correctly recorded 241 observations, but it grouped them into one trace, because that is exactly what I told it to do. The dashboard was right. I had built a single giant trace and expected a hundred small ones.
The scores were a second, separate problem. I was recording each score with span.update(output=...), which writes the value as span output. That shows up if you open the span, but it is not a Langfuse score object, so the Scores panel and analytics stayed empty. Span output and scores are different concepts, and the dashboard only reads the latter.
The fix: model the system, then instrument it
The fix was less about Langfuse and more about deciding what a “unit of work” is. I wanted one trace per eval item, with the query and its three scorers nested inside, and the scores attached as real score objects.
Three changes did it:
- Stop wrapping the whole loop. Instead, wrap each iteration in its own
eval_itemspan. That span becomes the per-item trace root, so the query and scorer spans nest under it instead of under one shared parent. - Capture the trace ID and emit scores explicitly. Inside the item,
get_current_trace_id()gives the trace handle. After scoring,create_score(trace_id=..., name="faithfulness", value=..., data_type="NUMERIC")attaches each metric as a first-class score object. - Group the run.
propagate_attributes(session_id=run_id, tags=["eval"])tags every trace from one run into a single Langfuse Session, so a run reads as one thing made of many traces.
In production, only the query span runs, so live traffic stays a clean one trace per request. The scorer spans appear only during eval runs, which is exactly where you want them.

The result
Same pipeline, same 40 questions, looped to 120 items for volume. This time the dashboard told the truth I was after:
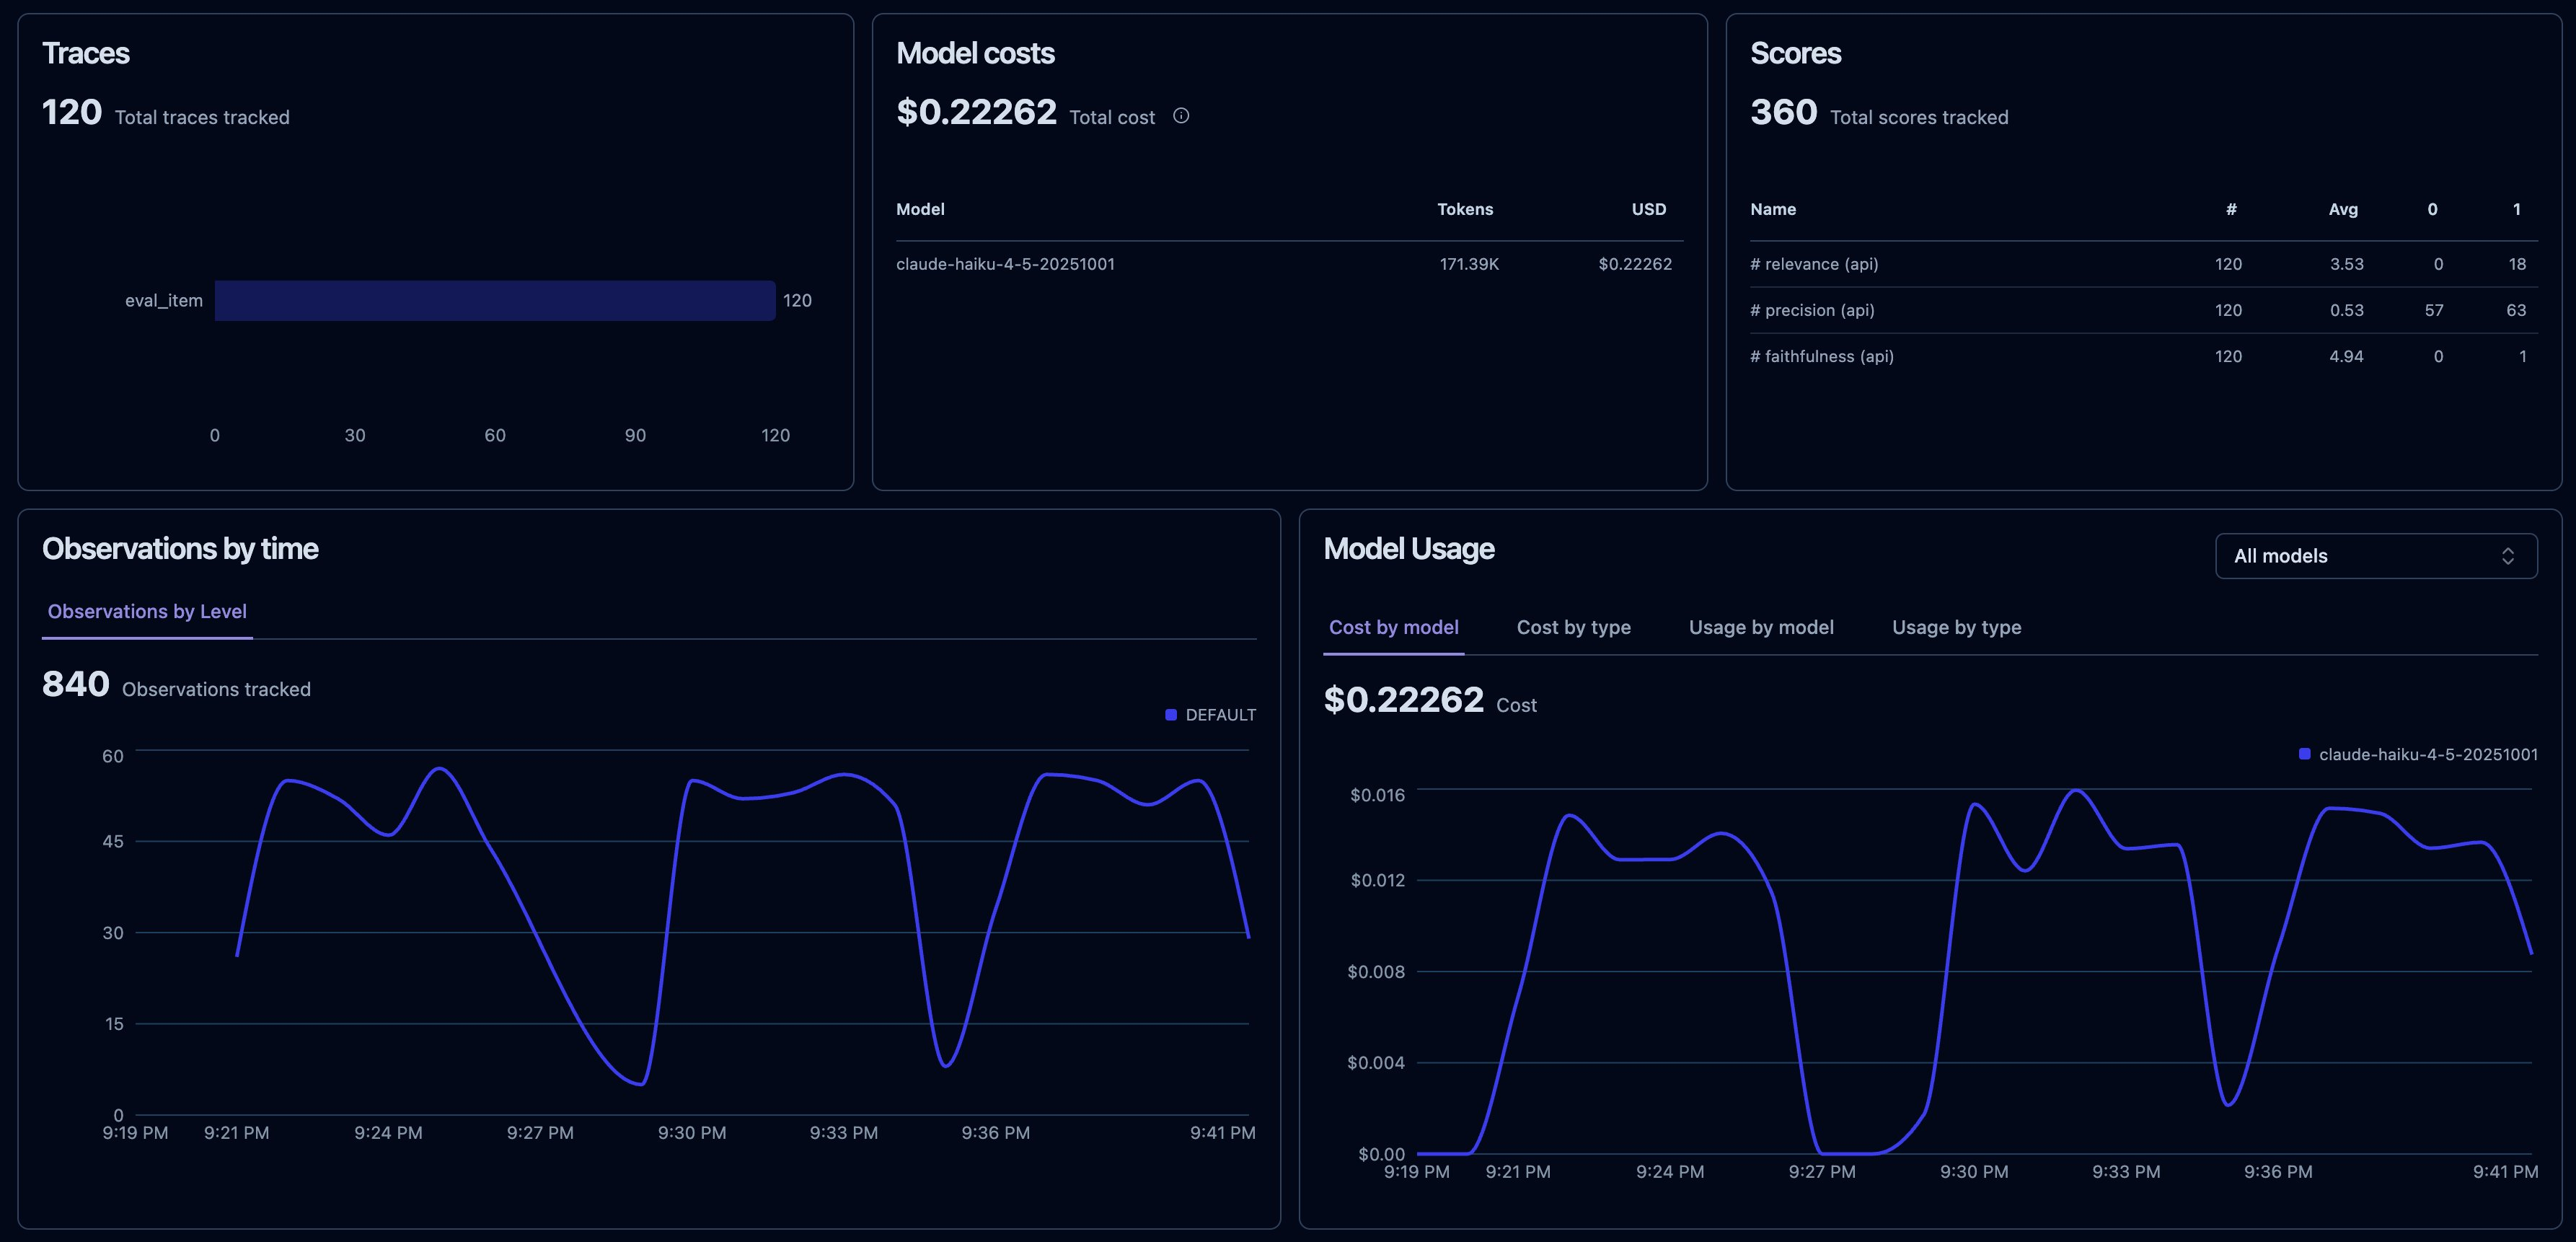
120 traces, 840 observations, 360 score objects (120 each of faithfulness, relevance, precision), and total cost tracked per model. The Scores panel populated, and so did Scores Analytics, with faithfulness sitting near 4.9 and precision around 0.53, which immediately tells me retrieval, not generation, is my weak link.
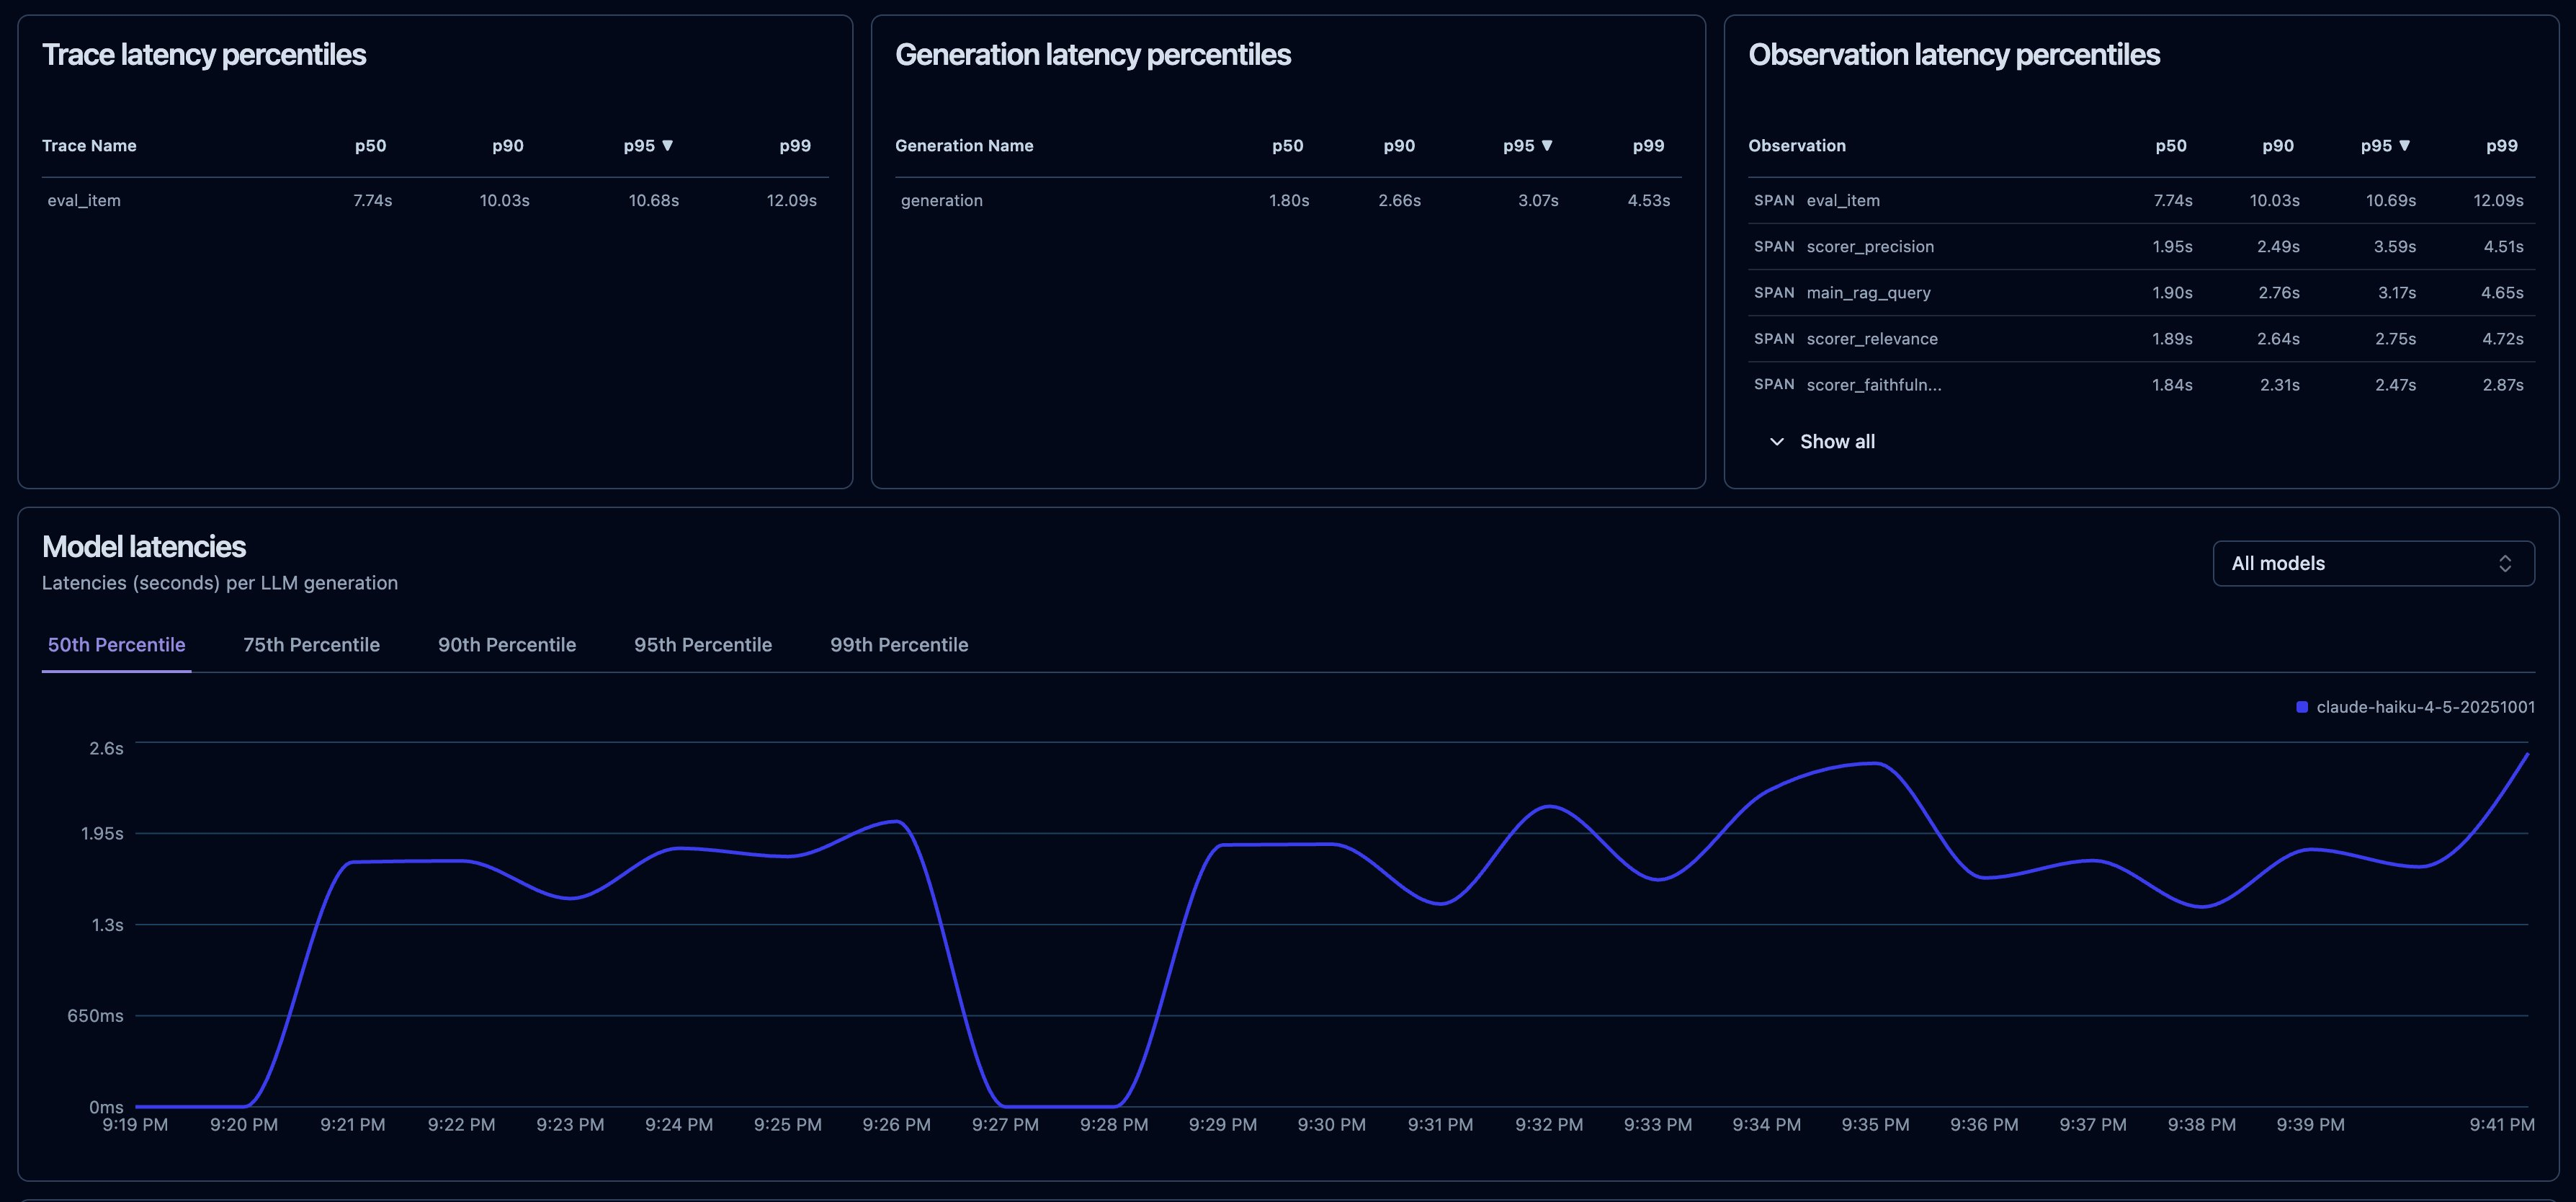
Latency came along for free, broken out by span at p50 through p99. Because of the nesting, the eval_item trace reports the full per-item duration while main_rag_query, generation, and each scorer report their own:
The takeaway
The thing I will remember from this week: observability is not a switch you flip, it is a model you build. The Langfuse SDK handed me cost and latency for almost nothing, and that creates a false sense that the rest is automatic too. It is not. Trace topology, what counts as one unit of work, and whether a number is a score object or just span output are all decisions you make, and the dashboard will faithfully reflect whatever decisions you actually made rather than the ones you meant to make.
If you are adding tracing to an LLM system and the dashboard looks empty or collapsed, resist the urge to debug the SDK first. Ask what a single trace is supposed to represent in your system, then check whether your instrumentation agrees. Nine times out of ten, that is the gap.